はじめに
この記事では、Pythonを用いて株式投資のシミュレーションを行う方法について解説します。今回は、トヨタ自動車株(7203.T)を毎月積立するケースを取り上げ、特定の月(ボーナス月)に追加投資を行うシミュレーションを実施。加えて、配当の再投資も考慮しながら実際の株価データを用いて、投資効果を評価していきます。
なぜPythonを使うのか?
Pythonは金融データの分析やシミュレーションに非常に便利なプログラミング言語です。データ分析用ライブラリが豊富であり、株価や配当のデータ取得も容易であるため、初心者でも簡単に投資シミュレーションを実装することが可能です。
シミュレーションの前提条件
今回のシミュレーションは以下の条件で実施します。
- 銘柄:トヨタ自動車(7203.T)
- 期間:2019年から現在まで
- 毎月の積立金額:30,000円
- ボーナス月の追加投資額:通常の3倍(90,000円)
- 配当金:実際の配当を再投資に使用
前提条件の設定理由
- 毎月の積立投資:毎月定額を積み立てることで、株価が高いときにも安いときにも定額を投資し、取得単価を平均化します。
- ボーナス月の投資:6月と12月に通常の3倍の積立を行うことで、タイミングを活用し資産を増やす効果を確認します。
- 配当金の再投資:配当金をそのまま受け取るのではなく、追加投資することで複利効果を狙います。
必要なライブラリのインストール
シミュレーションには、株価データの取得やグラフの描画が必要なため、以下のライブラリをインストールします。
pip install yfinance matplotlib pandas各ライブラリの役割
- yfinance:Yahoo Financeから株価データや配当情報を取得するために使用
- matplotlib:投資額やリターンをグラフ化して可視化
- pandas:データの整形や分析に必要
シミュレーションコードの実装
次に、実際のPythonコードを見ていきましょう。
import yfinance as yf
import datetime
import matplotlib.pyplot as plt
import pandas as pd

# 銘柄シンボルと期間の設定
ticker = '7203.T'
start_date = '2019-01-01'
end_date = datetime.date.today()

# 積立の金額設定
monthly_investment = 30000
bonus_investment = monthly_investment * 3

# Yahoo Financeから株価データ取得
df = yf.download(ticker, start=start_date, end=end_date)

# 月次データにリサンプル
df = df.resample('M').agg({'Adj Close': 'last'})
df = df.loc[start_date:]

# 配当データの取得
dividends = yf.Ticker(ticker).dividends
dividends = dividends[dividends.index >= start_date]
dividends = dividends.resample('M').sum()
dividends = dividends.reindex(df.index, fill_value=0)

# 配当の再投資を考慮した積立シミュレーション
closing_prices = df['Adj Close'].tolist()
dividend_values = dividends.tolist()

# 各月の購入株数と配当の再投資
units_purchased_with_dividends = []
total_units = 0

for i in range(len(closing_prices)):
    current_month = df.index[i].month
    investment = bonus_investment if current_month == 6 or current_month == 12 else monthly_investment

    total_units += investment / closing_prices[i]

    if i < len(dividend_values) and dividend_values[i] > 0:
        total_units += dividend_values[i] / closing_prices[i]

    units_purchased_with_dividends.append(total_units)

total_value_with_dividends = total_units * closing_prices[-1]
実装のポイント解説
- 月次データの取得:
yfinanceを用いてトヨタ自動車の株価データを月次ベースで取得し、終値を使用します。 - 配当データの処理:月ごとの配当データを取得し、シミュレーションに組み込みます。
- 購入株数の計算:毎月の積立と、配当の再投資を組み合わせた購入株数を計算しています。
結果の確認とグラフ表示
コードを実行すると、積立投資がどのようにリターンをもたらしたかがわかります。
グラフの作成
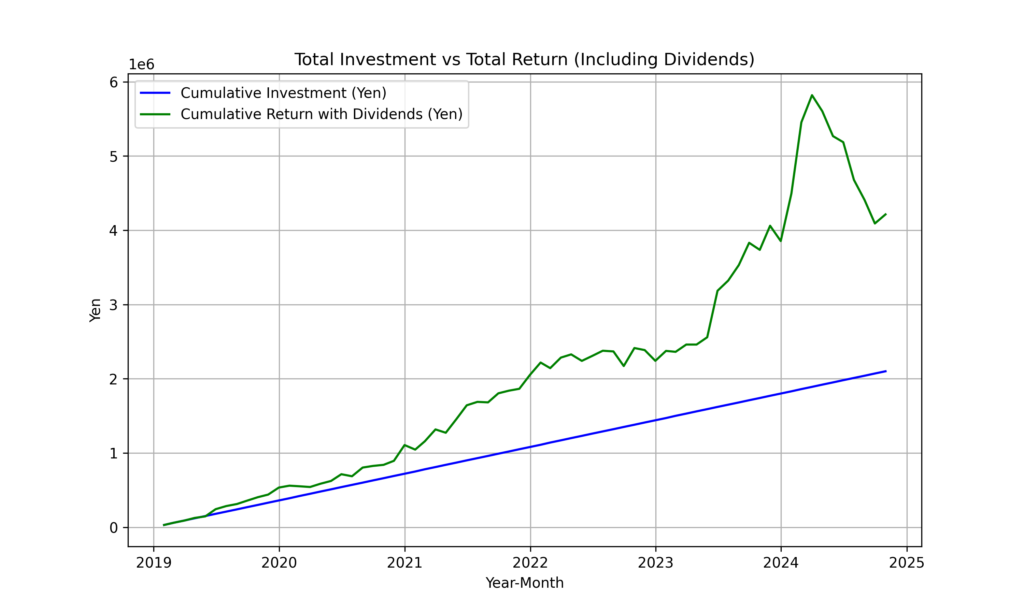
以下のコードで、累積投資額と累積リターン(配当再投資込み)のグラフを描画します。
plt.figure(figsize=(10, 6))

# グラフのプロット
plt.plot(df.index, [monthly_investment * (i + 1) for i in range(len(df))], label="Cumulative Investment (Yen)", color='blue')
plt.plot(df.index, [units_purchased_with_dividends[i] * closing_prices[i] for i in range(len(df))], label="Cumulative Return with Dividends (Yen)", color='green')

# グラフのラベルとタイトル
plt.xlabel('Year-Month')
plt.ylabel('Yen')
plt.title('Total Investment vs Total Return (Including Dividends)')
plt.legend()
plt.grid(True)
plt.show()
※Pythonのデフォルトでは日本語がグラフに表示できないためここだけ名称を英語にしています。
結果の出力(日本語表記)
最後に、最終的な結果を日本語で出力して確認します。
print("投資期間:", start_date, "から", end_date)
print("毎月の積立金額:", monthly_investment, "円")
print("ボーナス月の追加投資額:", bonus_investment, "円")
print("最終資産価値(配当再投資含む):", int(total_value_with_dividends), "円")
print("総投資額:", int(monthly_investment * len(df)), "円")
print("総利益:", int(total_value_with_dividends - (monthly_investment * len(df))), "円")
print("リターン率:", round(total_value_with_dividends / (monthly_investment * len(df)) * 100, 2), "%")
今回のトヨタ自動車に2019年から2024年10月までのシミュレーション結果は下記のようになります。リターン率200%とかなり好成績ではないでしょうか。
投資期間: 2019-01-01 から 2024-10-26
毎月の積立金額: 30000 円
ボーナス月の追加投資額: 90000 円
最終資産価値(配当再投資含む): 4213052 円
総投資額: 2100000 円
総利益: 2113052 円
リターン率: 200.62 %
投資シミュレーションのまとめと考察
- リターン率:配当再投資を含めることで、投資効率が上がることがわかります。
- 長期投資の有効性:毎月の積立とボーナス月の追加投資を組み合わせることで、安定した資産形成が期待できます。
最後に全てのコードをまとめて記載します。ご自身の会社や積立額に変更してシミュレーションに活用してください。
import yfinance as yf
import datetime
import matplotlib.pyplot as plt
import pandas as pd

# 銘柄シンボルと期間の設定
ticker = '7203.T'  # トヨタ自動車
start_date = '2019-01-01'
end_date = datetime.date.today()

# シミュレーション開始期間
start_simulation = '2019-01-01'

# 積立の金額設定
monthly_investment = 30000  # 毎月の積立金額
bonus_investment = monthly_investment * 3  # ボーナス月の積立金額

# Yahoo Financeから株価データ取得
df = yf.download(ticker, start=start_date, end=end_date)

# データの整理
df['Adj Close'].fillna(method='ffill', inplace=True)  # 調整後終値で埋める

# 月次データにリサンプル
df = df.resample('M').agg({'Adj Close': 'last'})  # 月次の終値
df = df.loc[start_simulation:]

# 配当データの取得
dividends = yf.Ticker(ticker).dividends
dividends = dividends[dividends.index >= start_simulation]  # シミュレーション期間に絞る
dividends = dividends.resample('M').sum()  # 月次の配当合計
dividends = dividends.reindex(df.index, fill_value=0)  # 株価データのインデックスに合わせて再インデックス

# 配当の再投資を考慮した積立シミュレーション
closing_prices = df['Adj Close'].tolist()
dividend_values = dividends.tolist()  # .tolist() でリスト変換

# 各月の購入株数と配当の再投資
units_purchased_with_dividends = []
total_units = 0

# 配当込みのシミュレーション
for i in range(len(closing_prices)):
    # ボーナス月かどうかの判定
    current_month = df.index[i].month
    if current_month == 6 or current_month == 12:  # 6月と12月はボーナス月
        investment = bonus_investment
    else:
        investment = monthly_investment

    # 投資による購入株数を計算
    total_units += investment / closing_prices[i]

    # 配当による再投資
    if i < len(dividend_values) and dividend_values[i] > 0:
        total_units += dividend_values[i] / closing_prices[i]

    units_purchased_with_dividends.append(total_units)

# 配当込みの最終価値
total_value_with_dividends = total_units * closing_prices[-1]

# 結果をPandasデータフレームにまとめる
investment_summary = {
    '積立期間': ['毎月', '総額'],
    '投資金額 (円)': [monthly_investment * len(df), (monthly_investment * len(df))],
    '購入株数': [sum(units_purchased_with_dividends), total_units],
    '最終価値 (円)': [sum(units_purchased_with_dividends) * closing_prices[-1], total_value_with_dividends],
    '利益 (円)': [total_value_with_dividends - (monthly_investment * len(df)), total_value_with_dividends - (monthly_investment * len(df))]
}

df_summary = pd.DataFrame(investment_summary)
print(df_summary)

# 総投資額と総リターンのグラフ化
plt.figure(figsize=(10, 6))

# グラフのプロット
plt.plot(df.index, [monthly_investment * (i + 1) for i in range(len(df))], label="Cumulative Investment (Yen)", color='blue')
plt.plot(df.index, [units_purchased_with_dividends[i] * closing_prices[i] for i in range(len(df))], label="Cumulative Return with Dividends (Yen)", color='green')

# グラフのラベルとタイトル
plt.xlabel('Year-Month')
plt.ylabel('Yen')
plt.title('Total Investment vs Total Return (Including Dividends)')
plt.legend()
plt.grid(True)
plt.show()

# 日本語での結果出力
print("投資期間:", start_simulation, "から", end_date)
print("毎月の積立金額:", monthly_investment, "円")
print("ボーナス月の追加投資額:", bonus_investment, "円")
print("最終資産価値(配当再投資含む):", int(total_value_with_dividends), "円")
print("総投資額:", int(monthly_investment * len(df)), "円")
print("総利益:", int(total_value_with_dividends - (monthly_investment * len(df))), "円")
print("リターン率:", round(total_value_with_dividends / (monthly_investment * len(df)) * 100, 2), "%")


コメント